Introduction
CVSSv3.1 is essentially the way in which vulnerability severities are assessed and ranked. Not everyone agrees that it is a virtuous or effective measurement. It is however a measurement in a problem area that defies easy empiricism. In this essay I will take a closer look at CVSSv3.1 and try to understand how it works, what it does well, and what it doesn't.
This article breaks into roughly two parts. The first part is a deconstruction of CVSSv3.1, looking at the data and how the calculation works. The second part then zooms out to look at CVSS in a broader context: other critiques, other scoring systems, and what the future holds. Obviously I want you to read all of it, but if you read only part of it, read the first part. That's where the salacious bits are.
CVSSv3.1 in a nutshell
For the end user, CVSSv3 works by presenting a series of variables, each with particular levels. The combination of levels is computed into a score, representing some degree of severity or danger. This score runs from 0.0 to 10.0, in increments of 0.1, giving 101 potential degrees of severity.
The variables and levels represent slices through the logical domain of what vulnerabilities are. For example, "Access Vector" represents that vulnerability severity depends on how hard it is to connect to the target computer system. A vulnerability that requires physical adjacency is considered less severe than one that requires network access, because detection and interception in a physical context are considered much more likely. And so it goes through the various variables and their levels, shown in the table below.
| Access Vector | Network Adjacent Local Physical | Attack Complexity | High Low |
|---|---|---|---|
| Privileges Required | None Low High | User Interaction Required | None Required |
| Scope Change | Unchanged Changed | Confidentiality Impact | None Low High |
| Integrity Impact | None Low High | Availability Impact | None Low High |
The distribution of available scores
A first thing to ask is: does every combination have a unique score? The answer is no. To begin with, there are 4 × 3 × 2 × 3 × 2 × 2 × 3 × 3 = 2,592 combinations of variable levels, but only 101 values to map them to.
Given a uniform distribution of scores, this would place ~25.7 CVSS scores per degree of the available scale. But is the distribution of scores generated by the equation uniform? Not at all.
The base score plot here enumerates every permutation of levels and feeds them to a cutdown version of first.org's code for calculating CVSS scores1, used in their interactive CVSSv3.1 calculator.
The first thing to notice is that the shape is not uniform — it's not a flat shape. In fact it loosely resembles a normal distribution, with more mass towards the centre and less at the fringes. The second thing to notice is that the full range is not used: while the maximum score is 10.0, the minimum score ever achieved is 1.6. That means that there are 101 - 16 = 85 actual degrees in use.
I must admit that I was skeptical of this distribution when I first saw it. Too neat, I thought. But then I began to change my mind: at a certain level, this shape makes sense. There are more permutations of levels which lead to central values than to outlying values.
Which is, basically, the Central Limit Theorem in action. I never quite believed or understood the CLT until I first saw a Quincunx board, also called a Galton board.
The magic of this board is that at each peg, there is a 50% of falling in either direction, but there are more paths leading to the central bin than to outlying bins. The right-most bin requires almost entirely right-falling balls, but the central bin can accept any mixture of left and right that adds up to approximately 50% of each direction. Basically, the Galton board recreates the process of repeated sequential samples being taken from a 50/50 pair of choices.
And so it appears to be in the case CVSSv3.1. There are more permutations of levels that lead to a middling score than the outlying score. Consider this not-a-Galton-board:
It's not a Galton board because the nodes aren't duplicated for each forking. That's partly because it would look very busy and partly because it would be a hassle to draw. But you can see that there are many paths through the graph, each giving a particular (though not necessarily unique) score. There are fewer paths with all "high" levels than there are paths with a mix of "high" and "low" levels. The Central Limit Theorem collects its dues and we are left with something loosely approximating a normal distribution.
Or so I thought.
The structure of the equation
But one thing at a time. Let's turn now to look more closely at the Base Score equation (found in §7.1 of the Specification). Or rather, equations, since it changes depending on the Scope Change level. Essentially you follow one path through the equations if you set Scope to "Changed" and a different path if you set Scope to "Unchanged". You can see below that it affects the Impact and Impact Sub-Score (ISS) equations.
Perhaps this is a little terse, so you can instead view it diagrammatically: Graphviz dot source
From the equations and diagram, a few things leap out.
- Scope Unchanged takes Impact Sub-Score as input twice. Each time it is reduced very slightly by magic numbers (0.02 and 0.029) and then either multiplied by 7.25 or raised to the 15th power. It's not clear why it needs to be manipulated twice — surely an equivalent manipulation could be performed just once. Your author is too lazy and inept to derive what it would be.
- Both score paths cap their scores at 0 and 10, suggesting that "impossible" figures can be generated. It's not a fatal flaw, but it's a smell. It means that 10.0s will be overrepresented in the set of permutations. And indeed that's what we observe: a spike in values at 10.0. An ideal scheme would limit itself to the range without needing a manual clipping step.
- Impact is added to Exploitability. But that doesn't make mathematical sense: they are distinct dimensions. It's like adding miles to minutes — distance and time are not commensurable. The breakdown into Impact and Exploitability seems to be a nod to the classic risk management idea that risk decomposes into impact (aka magnitude) and likelihood (aka probability or frequency). But in risk management these are multiplied to create a new combined dimension, typically denominated in dollars of risk exposure.
- There are a lot of magic constants. These are defined in §7.4 of the Specification. Sometimes magic numbers like these get derived from data as regression coefficients or the like. That's perfectly reasonable. But were these numbers so derived?
Magic numbers
The designers of CVSSv3.1 anticipated my concern about the magic numbers in §7.5 of the Specification:
To produce the CVSS v3.1 formula, the CVSS Special Interest Group (SIG) framed the lookup table by assigning metric values to real vulnerabilities, and a severity group (low, medium, high, critical). Having defined the acceptable numeric ranges for each severity level, the SIG then collaborated with Deloitte & Touche LLP to adjust formula parameters in order to align the metric combinations to the SIG's proposed severity ratings.
Feels a little squidgy. They continue:
By consensus, and as was done with CVSS v2.0, the acceptable deviation was a value of 0.5. That is, all the metric value combinations used to derive the weights and calculation will produce a numeric score within its assigned severity level, or within 0.5 of that assigned level. For example, a combination expected to be rated as a “high” may have a numeric score between 6.6 and 9.3.
My reading is that the guiding rule was that the SIG assigned a linguistic score ("Low", "Medium", "High", "Critical") to some sample of scenarios and then tweaked the magic numbers until the numerical scores (0.0-10.0) matched their expectations, with a bit of wiggle room allowed.
It's a little hard to tell if my reading is correct by consulting historical records, because I can't find mailing list archives or meeting minutes that cover the development of CVSSv3.1. There are meeting minutes for CVSSv2, but I want to see what was said about CVSSv3 and v3.1.
How important are these constants? In the example below I enable you to play with values for the magic constants. You may remember them as the red hexagons in the equations diagram.
Excluded, for my sanity and yours, are the 19 different weights given to different variable levels (the rectangles in the equations diagram).
Playing with the constants is a process of disillusionment. The plot shape I first considered suspicious, and which I then attributed to the Central Limit Theorem, actually turns out to be a consciously constructed shape after all. As you play with the constants you'll see this too.
I am reminded of the quote about equations with many parameters:
With four parameters I can fit an elephant, and with five I can make him wiggle his trunk. —Attributed to John von Neumann by Enrico Fermi
To recap what this interactive plot demonstrates: the distribution of CVSSv3.1 scores into an approximately normal shape is not due to underlying data. It's not due to the Central Limit Theorem acting on many permutations. It is entirely a designed outcome. There is nothing natural here. Any resemblance to natural phenomena, living or dead, is purely coincidental.
I don't know why this decision was made; perhaps someone will tell me. I don't see the value in generating a fake normal distribution versus a fake uniform distribution. In fact, you might even design a distribution that's quadrilateral and skewed so that the mass is biased away from higher scores, avoiding crowding at that end.
How did I get confused and attribute the shape to the Central Limit Theorem? My mistake was in treating each variable as an independent trial with its different levels as outcomes. If CVSS was a tree-structured mechanism, where each node represented a particular variable and each branch a particular level of that variable, then yes, it would be natural to assume (or straightforward to engineer) a normal distribution from the path of many different vulnerabilities through that tree.
But CVSS is not tree-structured. It's a group of equations, presumably derived from a mixture of manual tweaking and regression. The outcome looks normal because it was made to look normal, not because of an underlying process of sampling leading to normality.
The distribution of actual scores
Given that CVSS scores were designed to resemble a normal distribution, do the actually reported cases follow the normal-ish distribution?
No.
This figure shows data from 2019, 2020 and 2021. Two patterns appear in the data for all three years:
- High and Critical reports are overrepresented vs what would appear with a purely random sampling process over a uniform distribution of vulnerabilities in the wild.
- The data are spiky. Particular values are very highly overrepresented.
The overrepresentation of High and Critical (or perhaps it's really an underrepresentation of Low) is reasonably attributable to reporter incentives. Reporting a CVE requires some effort. For vulnerabilities scored Low, it may not seem to a product vendor to be worth the bother. But for High and Critical, there is potential reputational damage for knowing the vulnerability, not reporting, and then having it reported or (worse) exploited by somebody else.
Similarly, for security researchers, there is far more glory to be earned from finding High and Critical vulnerabilities than finding lots of Low ones.
But the elephant in the room is that these plots are very close to being identical, despite being from three different years with different data sets. The biggest change is in scale from year to year, and an inversion of 7.5 and 7.8 between 2019 and 2020. But otherwise the eyeball test says that these are the same plot.
If you plot two of them on a score-for-score basis, the picture becomes even more dramatic:
If you showed up to publish in an academic journal with an R² value of 0.99, the reviewers and editors would suspect that you either (1) stuffed up your analysis, or (2) made up data. Just made it the hell up. In practice 0.99 doesn't happen. So why does it happen here?
We can at least rule out invented data. This is the real data from the NVD, representing reports from many individual reporters over thousands of reports. Collusion is unlikely and in any case would be pointless.
Another argument might be that if you viewed vulnerability as a kind of collection of Markov processes, then the structure and biases of such processes will be fairly stable from year to year. This is plausible. But it doesn't account for another highly visible property of the annual plots: their spikiness. Reports in both years cluster very tightly around only a few scores. Even if the generation of flaws was a stochastic process that was stable year over year, there's no obvious reason why such a process would have a laser focus on just a handful of scores.
This leaves me to suspect that something in the mechanism of CVSS is responsible for the clustering. To see if that is the case, let's look closely at the four biggest spikes.
The big four: 7.5, 7.8, 8.8 and 9.8
There are 47 permutations to reach 7.5, 12 to reach 7.8, 11 to reach 8.8 and 1 to reach 9.8. I have a table below, which for brevity's sake skips 7.5.
| Vector | Complexity | Privs. Reqd. | User Int. | Scope Change | Conf. Impact | Integ. Impact | Avail. Impact | |
|---|---|---|---|---|---|---|---|---|
| 7.8 | L | L | N | R | U | H | H | H |
| 7.8 | L | L | L | N | U | H | H | H |
| 7.8 | A | H | N | R | C | L | H | H |
| 7.8 | A | H | N | R | C | H | L | H |
| 7.8 | A | H | N | R | C | H | H | L |
| 7.8 | A | L | H | R | C | L | H | H |
| 7.8 | A | L | H | R | C | H | L | H |
| 7.8 | A | L | H | R | C | H | H | L |
| 7.8 | L | H | N | N | C | N | H | H |
| 7.8 | L | H | N | N | C | H | N | H |
| 7.8 | L | H | N | N | C | H | H | N |
| 7.8 | L | H | L | N | C | H | H | H |
| 8.8 | N | L | N | R | U | H | H | H |
| 8.8 | N | L | L | N | U | H | H | H |
| 8.8 | A | L | N | N | U | H | H | H |
| 8.8 | N | L | N | R | C | L | L | H |
| 8.8 | N | L | N | R | C | L | H | L |
| 8.8 | N | L | N | R | C | H | L | L |
| 8.8 | A | L | N | N | C | L | L | H |
| 8.8 | A | L | N | N | C | L | H | L |
| 8.8 | A | L | N | N | C | H | L | L |
| 8.8 | A | L | N | R | C | H | H | H |
| 8.8 | L | L | L | N | C | H | H | H |
| 9.8 | N | L | N | N | U | H | H | H |
Disappointingly, there doesn't seem to be a discernible all-or-nothing pattern. There are patterns, though. Attack Complexity drops to "Low" as scores increase, which is to be expected. Privileges drop to "None" as scores increase. Most scopes are "Changed", which possibly reflects the 8% boost given to Changed scores in the final step of the equation.
But while there is no singular smoking gun, there are at least a few smouldering water pistols. If we look at the variable level weightings, we can see why Attack Complexity, Privileges and Scope have so much leverage:
- Attack Complexity
- High: 0.44
- Low: 0.77
- Privilege Required
- If Scope is Changed
- None: 0.85
- Low: 0.68
- High: 0.5
- If Scope is Unchanged
- None: 0.85
- Low: 0.62
- High: 0.27
- If Scope is Changed
- Scope
- Changed: 7.52
- Unchanged: 6.42
One thing to notice is that Scope Change gets a double dip here. It both affects its own multiplier and it affects the weights given for Privilege Required. And then, of course, it forces a switch between two sets of equations having quite different internal structures. And indeed, if we plot out the proportion of scores having Changed vs Unchanged, a very clear pattern emerges:
So if there is a villain in story, it appears to be the Scope Change variable. It affects the score calculated in at least three different ways. This makes it harder to understand and distinguish from other effects. I am not sure why it was singled out for special treatment; it feels as though a case could be made for any of Attack Vector, Attack Complexity, Privileges Required or User Interaction as being bifurcating variables.
Scope Change is not the easiest concept to grasp, and the authors of CVSSv3.1 devote considerable space to explaining it and providing examples. But I couldn't find an explanation of why Scope is treated as a special case. Once again I am stymied by the lack of meeting minutes or mailing list archives.
Other critiques
That's quite enough of my opinions. What have others said?
It would be surprising if I were the first person who had ever criticised CVSS. In fact it's something of a cottage industry. Broadly the criticisms fall into two groups: the first is criticism of using CVSS to identify risk; the second is critical of CVSS as a scoring system.
"You're holding it wrong"
The first criticism is basically telling folks that they're holding it wrong. The followup is usually to suggest some additional step to map CVSS to risk exposure (example, example). These sorts of critiques are commonly found among software vendors, and reasonably enough, since they're the ones made to hold the bag.
A subset of these articles, coming from threat intelligence companies (example, example), argues that a key missing ingredient is applying data about actual in-the-wild exploitation of a vulnerability. Again, reasonable, but ultimately the argument is still that CVSS is "kinda OK", just not enough by itself.
"CVSS is wrong"
The second family of critiques is much more interesting to me. It's one thing to tell folks "you're holding it wrong" and another entirely to argue that "it" can't be held correctly at all.
Let's talk first about Risk Based Security's series, CVSSv3: Newer is Better, Right?. The background for the series is that folks working at this company were also critical of the previous version, CVSSv2. This series is a point-by-point breakdown of how they feel that v3 also failed to live up to their standards.
Summarising their criticisms:
- They feel that the definitions for the Attack Vector levels "Network" and "Local" are ill-defined. They present a paradoxical case where a vulnerability against PDF readers is "Local" if you download the file and open it again, but "Network" if it renders immediately in a browser.
- They note that Attack Complexity criteria include a submerged concept of exploit reliability, or ease of exploitation. This overlaps with a variable in the Temporal Score, "Exploit Code Maturity". They give an example where the Base Score changes as an exploit evolves from a hypothesis to being available in fully automated form. But this isn't supposed to happen at all. Things that change over time are meant to be isolated in the optional Temporal Score, not in the Base Score.
- They warn that the concept of Scope is confusing, but has high leverage on what scores are generated. By now this should be apparent to you, given that completely different equations are used depending on what Scope level is selected.
- They think that granularity for Attack Complexity is insufficient (there are only two levels: High and Low). They consider this as a worsening of the design vs CVSSv2, which had three levels for what was then called "Access Complexity".
- They point out that no remote vulnerability can score below 5.0, no matter how trivial it might otherwise be. This increases noise in the space of "Medium" vulnerabilities.
- They point out that when using CVSSv2 and CVSSv3 side-by-side, v3 consistently scores higher than v2 (their criticism applies to CVSSv3.1 as well). They consider this score inflation unhelpful, as it increases the workload for administrators by compressing scores towards Medium, High and Critical levels.
At the conclusion of the series, the authors write:
When we initially learned about some of the changes to CVSSv3, we were very hopeful. While we do acknowledge and see improvements over CVSSv2, the newly introduced problems – in partial due to guideline changes – ultimately do not make it much better than what it supersedes. At least it is not what we had hoped for and what we believe the industry needs.
I see the Risk Based Security (RBS) critique as mostly being about the implicit causal structure of CVSSv3.1. As a scoring system it assumes certain steps and characteristics affect the outcome — essentially, a hypothesis of what a vulnerability is. The RBS critique picks at the components of this implied causal model and how it then maps to numerical scores.
The second critique I discuss here has a very different emphasis. The paper is Towards Improving CVSS, by J.M. Spring, E. Hatleback, A. Householder, A. Manion and D. Shick of the Software Engineering Institute (there is also an introductory blog post).
The authors don't pull their punches in the Executive Summary:
The Common Vulnerability Scoring System (CVSS) is widely misused for vulnerability prioritization and risk assessment ... Furthermore, the CVSS scoring algorithm is not justified, either formally or empirically. Misuse of CVSS as a risk score means you are not likely learning what you thought you were learning from it, while the formula design flaw means that the output is unreliable regardless. Therefore, CVSS is inadequate.
By volume, the bulk of this paper revisits the criticisms that we've seen: CVSS is meant for vulnerability severity, but folks use it to provide a ranking of risk. It fails to account for contextual information such as how vulnerabilities can be chained. It doesn't account for impact beyond its palette of Confidentiality, Integrity and Availability — so what happens if the impact to be weighed is human lives and livelihoods?
Of some interest to me is that they point to this paper by Allodi et al, in which it is disclosed that security experts scoring the same vulnerability may give scores varying by up to 4 points. Which is ... a lot. The entire range of "Critical" is less than 4 points wide. Some comfort is given by the finding that security professionals are better at scoring.
But of most interest to me is the first section of their critique: "Lack of justification for the CVSS formula". It is, in academic writing terms, quite scathing about the birth and construction of CVSSv3.1.
Firstly, they point out, the equation doesn't actually make sense mathematically, in that it combines ordinal measures (High, Low) in a numerical way. As they point out, this is strictly nonsensical:
For example, “fastest + fastest” does not make sense, whether we label “fastest” as “1” or not.
This ties to one of my own complaints, which is that more than once I have seen folks take averages of CVSS scores. They're just numbers, right?
Not really. CVSSv3.1 scores should be considered as rankings, which makes them an ordinal measure. Ordinal measures can't be added, multiplied or divided in a meaningful way, which rules out averaging.
Not convinced? Imagine that there was no numerical score, only the linguistic scores of "Critical", "High", "Medium" and "Low". What's the average of Critical and Medium? Of High and Low? There isn't one. The question isn't meaningful because these are ordered but otherwise have no concept of distance to compare them by; a score of 10.0 isn't equal to twice a score of 5.0. The 0.0 to 10.0 range offered by CVSSv3.1 isn't really a numerical score. It's a ranking score with 101 buckets. Stop averaging it.
But back to our friends at the Software Engineering Institute. They are displeased that even if you use alternative statistical methods to relate ordinal values to each other, no information is given as to how this was achieved by the designers of CVSSv3.1:
CVSS takes ordinal data such as [unavailable, workaround, temporary fix, official fix] and constructs a novel regression formula, via unspecified methods, which assigns relative importance rankings as ratio values. The CVSS v3.0 documentation offers no evidence or argument in favor of the robustness of the given formula or construction method. Since the formula, strictly speaking, commits a data type error, the burden of proof lies with the specification. This complaint is not the same as asking why low attack complexity is 0.77 instead of, perhaps, 0.81; it is also not the same as wondering why the impact subscore involves a 15th power instead of the 14th. The complaint is that we have been given no evidence that the formula is empirically or theoretically justified.
We have a variety of other methodological questions because the CVSS v3.0 specification offers no transparency on the whole formula creation process. The initial ranking of vulnerabilities affects the result, so how this was done matters. Further, while the descriptions for the metrics are clear, how their relative importance was selected is not. Different communities would plausibly find different metrics more or less important (confidentiality versus availability, for example), as we discuss below. These various problems contribute to concern that the CVSS v3.0 formula is not robust or justified.
I think these two paragraphs say about the worst that can be said about CVSSv3.1: it's currently unjustified and there's no obvious way that it could be justified. It's a mathematical sleight of hand, like those trick "proofs" that purport to show that 1 + 1 = 3.
Alternative schemes
There are surprisingly many of these, some of which have languished in nigh-total obscurity (for example, I recently saw two seasoned security experts say they'd never even heard of CWSS). I'll focus on two categories: vendor-specific and general purpose schemes.
Vendor schemes
A large amount of opensource software has one or more vendors, who will in some form accept responsibility for ensuring the software is viable and reliable. This is a kind of insurance for end users. In exchange for payment, the vendor guarantees that supported software will remain supported for some period, even if the upstream it comes from disappears, dies or otherwise becomes unusable. This is very attractive to larger firms, whose risk appetite is ladled out in years at a time. A similar dynamic exists for proprietary software firms, with the difference that there's a narrower gap between source origin and support contract that needs to be insured.
But there's a flipside for the vendor: when a vulnerability is announced, they are the ones who are paid to hold the bag. Their customers may fairly point to a scary CVSS score and demand immediate action. But what if, in fact, the score makes no sense in a broader context? The vendor is stuck with the problem anyhow.
Some of them don't like this state of affairs, and so they instead publish guidance according to their own schemes. For example, Red Hat have a "Severity Ratings" scheme, running from "Critical impact":
This rating is given to flaws that could be easily exploited by a remote unauthenticated attacker and lead to system compromise (arbitrary code execution) without requiring user interaction. Flaws that require authentication, local or physical access to a system, or an unlikely configuration are not classified as Critical impact. These are the types of vulnerabilities that can be exploited by worms.
Down to "Low impact":
This rating is given to all other issues that may have a security impact. These are the types of vulnerabilities that are believed to require unlikely circumstances to be able to be exploited, or where a successful exploit would give minimal consequences. This includes flaws that are present in a program’s source code but to which no current or theoretically possible, but unproven, exploitation vectors exist or were found during the technical analysis of the flaw.
In the documentation they discuss that while Red Hat also calculates CVSSv3.1 scores, they don't rely exclusively on them:
Red Hat does not solely use the CVSS rating to determine the priority with which flaws are fixed, or to determine the severity rating of the vulnerability. It is used as a guideline to identify and describe key metrics of a flaw, however the priority for which flaws are fixed is determined by the overall severity of the flaw using the aforementioned four-point scale.
They also point out the context problem. Most of what people refer to as "the" CVSS score is really the score recorded in the National Vulnerabilities Database (NVD). But the NVD only records a single Base Score that must somehow cover all the ways that software might be installed, configured, operated or secured. Hence, the Red Hat documentation says that:
For open source software shipped by multiple vendors, the CVSS base scores may vary for each vendor's version, depending on the version they ship, how they ship it, the platform, and even how the software is compiled. ... These differences can cause the scores to vary widely.
Unsurprisingly this means they tell you to rely on Red Hat's own scoring:
For these reasons, we recommend that, whenever possible, you use a CVSS base score provided by Red Hat in preference to a score from a third party.
Sometimes vendor scoring systems can be confusing. One such case comes from Microsoft, who publish not one but two scoring systems: the MS Exploitability Index and the MS Security Update Severity Rating System.
Now in fairness, they are different in nature and scope. The Exploitability Index mostly focuses on whether exploits are known to be occurring, or if not known, an estimate of how likely exploitation is (this idea will return below when we discuss EPSS). The Security Update Severity Rating System (say that five times quickly) instead looks more like being like CVSS, insofar as it describes a causal model of what leads to exploitation. One key difference is that the latter at least gives explicit guidance on what to do (eg "Microsoft recommends that customers apply Critical updates immediately").
But when the two are taken in combination, it seems as though they can fall into disagreement and thus create ambiguity about what should be done. And if they don't disagree, why have two different schemes in the first place? I accept that this was very unlikely to be an intentional state of affairs, but it is still unfortunate.
General purpose schemes
I could go on for a lot longer about vendor schemes because a natural law requires vendors to develop them once they reach a sufficiently Enterprise™ level of complexity and size. But the schemes we've looked at are just to make life easier for the vendor. What about the general case?
Here we come to the alternatives vying to displace CVSS entirely, created using different design principles. There are three of these that I will discuss:
- The SEI's Stakeholder-Specific Vulnerability Categorization (SSVC, geddit?)
- FIRST.org's Exploit Prediction Scoring System (EPSS)
- NIST's Vulntology
What they share in common is that they are newer than the venerable CVSS, and that each is in some way inspired by the shortcomings of CVSS. But otherwise they are each quite distinct.
Stakeholder-Specific Vulnerability Categorization
SSVC (see here for the v2.0 paper) comes from a team at the Software Engineering Institute (SEI). Its authors include a number of the folks who authored the Towards Improving CVSS paper I discussed above.
The key mechanism of SSVC is very different from CVSS. Instead of being a numerical equation with ordinal inputs, SSVC is a decision tree. At each level of the tree (eg. Exploitation, Automatability etc) you are presented with multiple branches, representing alternative levels of a given variable. At the leaves of the tree you are given one of three reactions to the vulnerability: Track, Attend, or Act. Ultimately there are 3 × 2 × 2 × 3 = 36 permutations. Far fewer than CVSS.
This enormously abbreviated textual description is much more easily viewed in graphical form.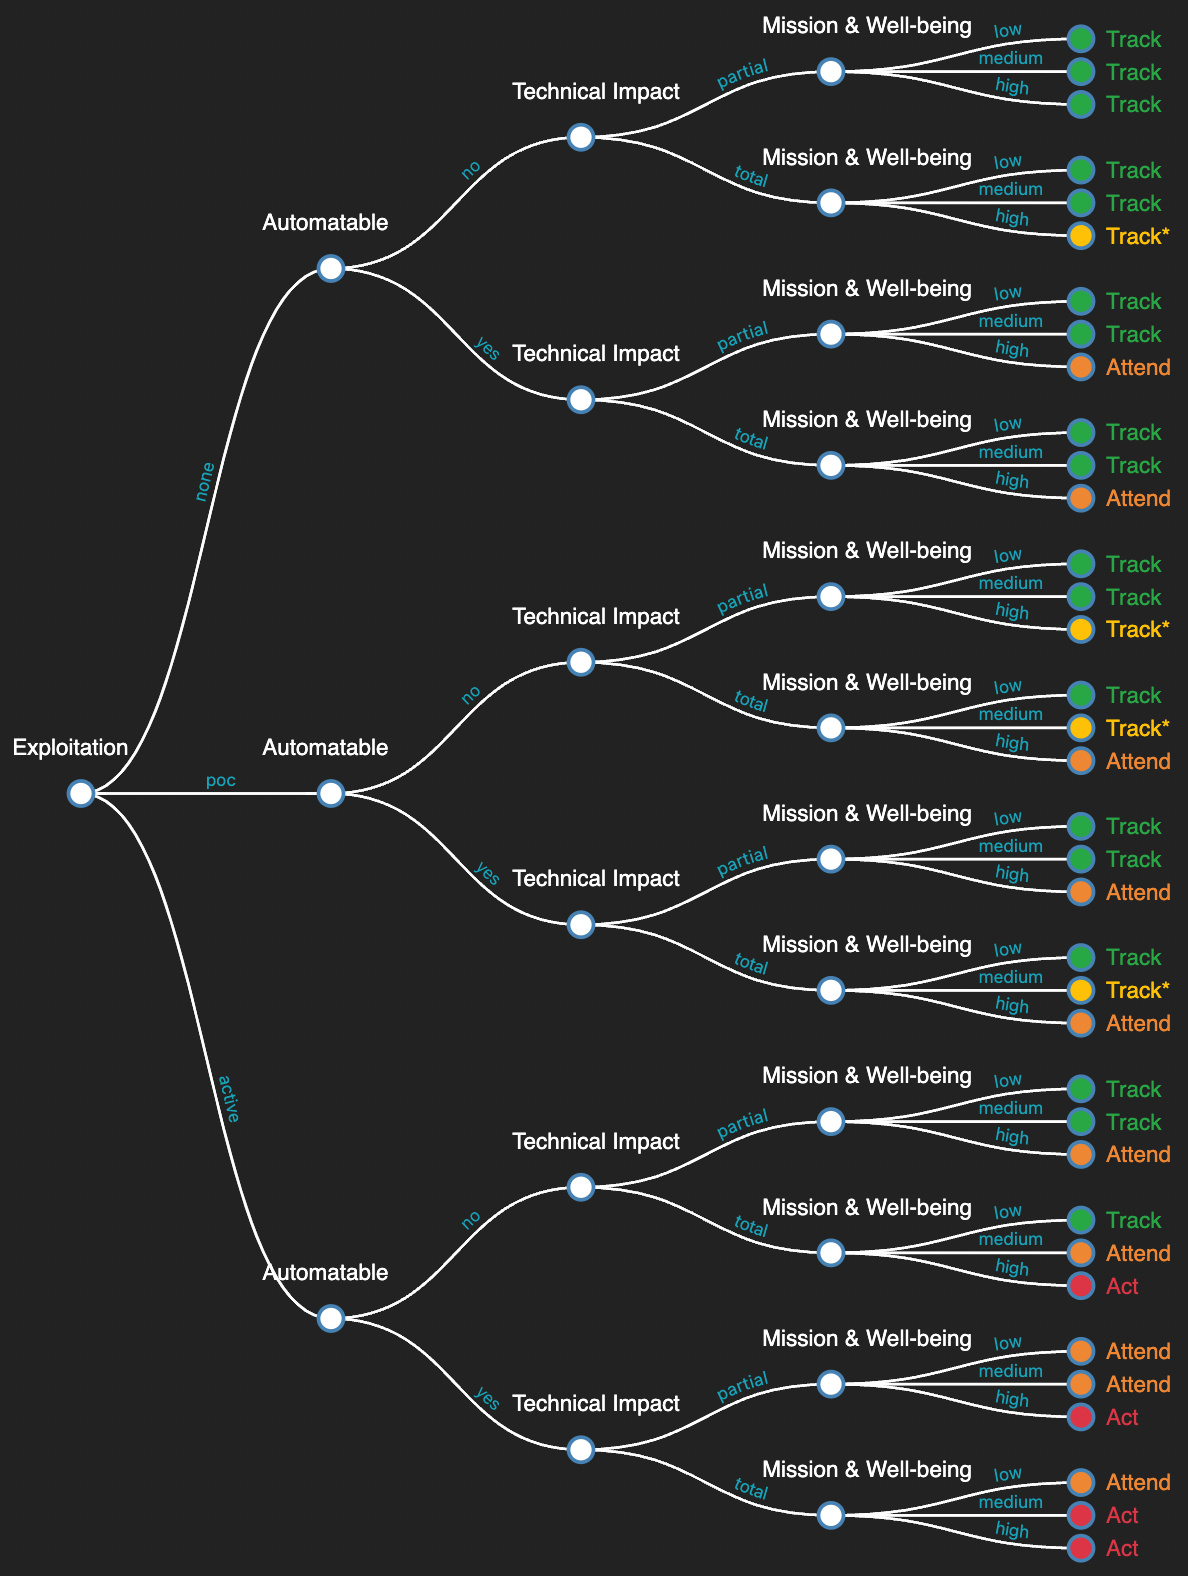
From left to right, the scoring analyst answers for whether a vulnerability is known to be exploited, whether the exploitation is automatable, the technical impact of exploitation, and the effect on a system's mission and/or life and livelihoods. At the leaves it gives the concrete recommendations as to what should be done.
This decision tree approach has some distinct advantages. For one, it never pretends to be numerical in nature. It starts with ordinal inputs and ends with ordinal outputs, remaining ordinal throughout. Another advantage is there's no false precision of the kind that CVSS's decimal point format implies.
I am ambivalent about the inclusion of Exploitation status and Automatability. As noted above, threat intelligence vendors have long argued that CVSS without exploitation and exploitability data is sterile and incomplete; SSVC seems to take this to heart. But it also misses out on one of the good features of CVSS as designed, which is that it attempts to separate what is timeless (the Base Score) from what changes (the Temporal Score). This means that the guidance given by SSVC needs to be updated when available information changes. By no means impossible to achieve with some measure of automation, and certainly amenable to integration with threat intelligence vendors. But still, some of the neatness is lost.
The other area where SSVC arguably falls short is that it has a simpler implied causal model than CVSS does. In the critique by Risk Based Security discussed above, it was argued that CVSS was not detailed enough. But SSVC goes from CVSS's eight variables down to just four. It might be argued that three of CVSS's variables (Confidentiality, Integrity and Availability) can be usefully compressed into the SSVC Mission & Well-Being variable. That still leaves a substantial gap in the input permutations between the two schemes.
These quibbles aside, the SSVC v2.0 document is well worth your time. It contains a lot of insightful critiques of CVSS, either directly or implicitly through the design decisions by the authors. It is exhaustively thorough, which is a desirable property for a scoring system that could be used to steer billions of dollars of spending and prioritise the retirement of trillions of dollars of risk. I hold SSVC in very high regard and, given a forced choice between SSVC and CVSS, I'd pick SSVC.
Exploit Prediction Scoring System
EPSS represents a fundamental inversion in how to design a scoring system. Whereas most scoring systems work forward from a causal model to a scoring or ranking, EPSS works backwards from actually observed outcomes to derive the model. Distinctly from CVSS and SSVC, it has no nominal component. Analagous to how SSVC's purity is due to only being nominal, EPSS's purity is due to being purely numerical.
In concrete terms, EPSS works by taking vast amounts of data about known exploitations (when, where, what was exploited, who wrote the software, etc) and getting some clever statistical algorithms to chew the data thoroughly into a digestible form. This outputs an equation which encodes the handful of factors with the strongest relationship to whether or not an exploit will occur in the next 30 days. When calculated, the result is a probability score between 0 and 1, though typically presented as percentages for the comfort and convenience of non-statisticians.
What kind of factors are we talking about? Well, for example, the top five most influential factors in the current data are:
- Code exploitation (it's not clear to me what this is meant to entail, exactly)
- Whether there is an entry in the Exploit DB
- The number of references to other resources included in the National Vulnerability Database entry
- Whether the vendor is Microsoft
- Whether there is a module for the exploit available for the popular penetration toolkit Metasploit
It should be clear that we can use these kinds of data-driven associations to guess at hypotheses, but we don't necessarily have a fully-explained causal model. For example, you can choose to interpret the Microsoft variable as meaning either "Microsoft software is extremely widespread", or "Microsoft customers are slow at applying patches", or uncharitably that "Microsoft sucks at security", or perhaps some combination of these. The EPSS doesn't distinguish or render judgement. It merely follows what the data show.
Distinct from CVSS and SSVC, EPSS does not define linguistic variables or bins for scoring. In their article Probability, Percentiles and Binning, EPSS contributors Sasha Romanosky and Jay Jacobs write:
A third alternative to presenting EPSS probabilities is with categorical (ordinal) labels, such as "fix now / fix later," or "low, medium, high, critical." Bins provide a simple heuristic for users, and bypasses the cognitive effort required to process numerical distributions of values. Heuristics are important and useful mental shortcuts that we employ every day when making decisions, and can also be useful here.
The "third alternative" refers to the fact that EPSS supports probability, which we have discussed, and percentile rankings, which we haven't (and won't, it's a bit esoteric for our purposes). They continue:
However, there are a number of problems with binning. Bins are, by construction, subjective transformations of, in this case, a cardinal probability scale. And because the bins are subjectively defined, there is room for disagreement and misalignment across different users. There is no universal "right" answer to what the cut off should be between a high, and medium, or medium and low.
Moreover, arbitrary cutoffs force two scores, which may be separated by the tiniest of a value, to be labeled and then handled differently, despite there being no practical difference between them. For example, if two bins are set and the cutoff is set at 0.5, two vulnerabilities with probabilities of 0.499 and 0.501 would be treated just the same as two vulnerabilities with probabilities of 0.001 and 0.999. This kind of range compression is unavoidable and so any benefits from this kind of mental shortcut must be weighed against the information loss inevitable with binning.
All of which is to say that EPSS always provides a numerical score, and that the decision of what to do is still left to the end user. At first blush this seems like it imposes an unfair categorisation burden on the user, but that's not entirely true. Recall that a key use for all these scoring systems is to decide what the next-most-valuable thing to work on is. SSVC has the lowest resolution, having only 3 options. CVSS has up to 101. But EPSS provides, in theory at least, an infinite resolution. Two vulnerabilities can be distinguished to an arbitrary level of precision, ensuring that there is always going to be a distinct ranking between them (to the limits which the data allows, at least).
Like SSVC, EPSS has a temporal nature; the scores are never final. This is true in two ways. First, like SSVC, the score changes as the information about a given vulnerability changes (for example, the score changes when an exploit becomes available in Metasploit). But secondly, less obviously, the underlying data itself changes over time. It is not wholly clear to me how or whether this process is versioned — whether there is such a thing as an "edition" of the EPSS scoring equation, based on periodically refreshed data. But it has already been refreshed at least once, with the EPSS homepage noting that "The latest update to the EPSS model was released on February 4th, 2022".
This is more than hypothetical, as a case study on the Log4Shell vulnerability by Jay Jacobs demonstrates. As the vulnerabilty's timeline unfolds, its EPSS result fluctuates in a range between 0.3 (30%) probability of exploitation and 0.944 (94.4%), with the biggest jumps coming when prepackaged exploit modules are published, first to Exploit DB and then to Metasploit.
In the discussion in The EPSS User Guide, the authors appear to position EPSS as an adjunct or supplement to CVSS. As is common, they first of all disclaim that EPSS is not a measure of risk:
EPSS is estimating the probability of exploitation activity, which is just one of many considerations in a risk-based approach to vulnerability management. Because of that, EPSS should never be treated as a risk score. ... In regard to the (overly simplistic) risk formula, Risk = Threat × Vulnerability × Impact, EPSS relates only to the threat compoment [sic].
They then proceed to plot vulnerabilities on two axes: CVSSv3.1 scores and EPSS scores (I don't include it here as FIRST reserve their copyright). They note that there is visible correlation between the CVSSv3.1 and EPSS scores, but:
... this plot provides suggestive evidence that attackers are not only targeting vulnerabilities that produce the greatest impact, or are necessarily easier to exploit (such as for example, an unauthenticated remote code execution).
This is an important finding because it refutes a common assumption that attackers are only looking for — and using — the most severe vulnerabilities. And so, how then can a network defender choose among these vulnerabilities when deciding what to patch first?
This is an important finding. In exceptional cases like Log4Shell, EPSS adds only a limited amount of information to the pool drawn on by decision makers prioritising remediation work. But in the vast, vague and fuzzy land in the middle, EPSS provides a second signal which often doesn't perfectly correlate with CVSS. That is: it provides novel information which CVSS, by itself, does not reveal.
As with SSVC, the work behind EPSS is impressive. If I had one complaint, it's that the documentation is a little scattered. To be sure, I can find a collection at FIRST.org, but key insights and design principles are not concentrated in a single document the way that they are for SSVC and, to a lesser extent, for CVSS. I needed to read more or less everything to ensure I hadn't missed anything (and I probably did anyway). The closest thing to a single document is a paper that was presented at Blackhat 2019; it's not published on the EPSS website itself (though it is linked from it).
I'm unsure whether EPSS should be fully relegated to the role of second signal besides something like CVSS or SSVC, or whether it deserves top billing. This brings me to mention a distinction I would like to explore in another essay some day, which is the difference possibility and probability in computer security. CVSS is a scheme for describing possibility, albeit flawed. To a lesser extent SSVC is also about possibility, though masked beneath a decision making mechanism. But EPSS is about probabilities, not possibilities. What is believed to be, not what could imaginably be. In security we need to think of both, but in the long run I think you could do better relying solely on EPSS than relying solely on CVSS.
Vulntology
By way of confession I should explain that Vulntology is not an alternative scoring scheme at all. There is no equation, no decision tree, no machine learning. Vulntology is instead an ontology or schema, describing the "parts" that make up a vulnerability and related ideas.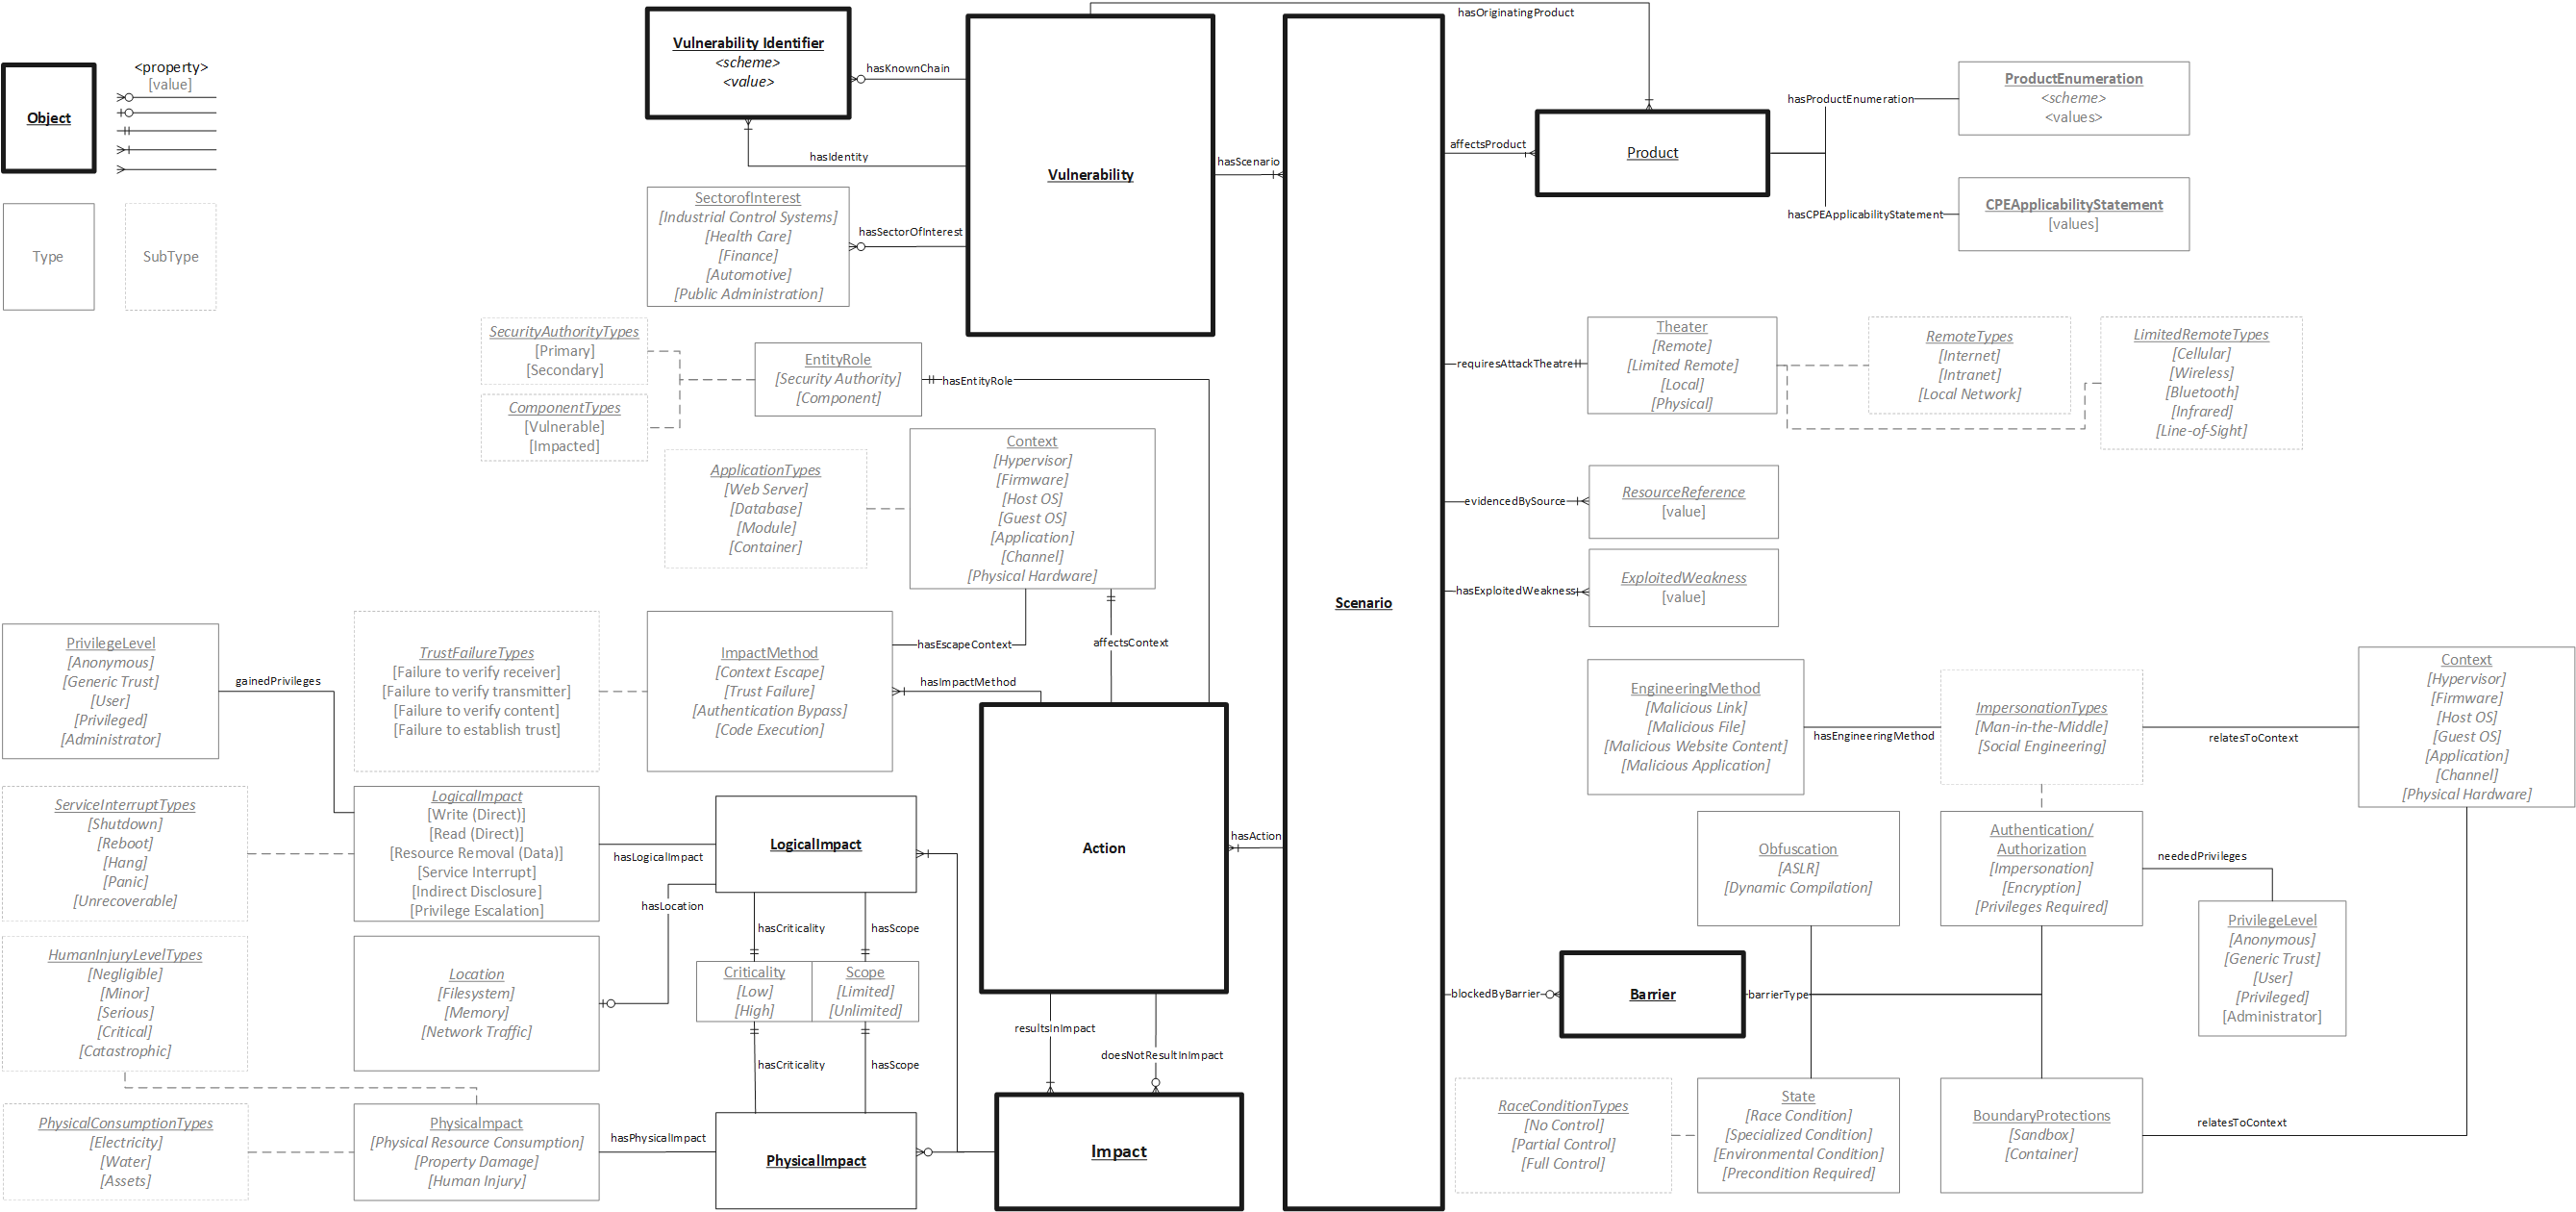
I included Vulntology because it represents in some ways the polar opposite to EPSS. It is entirely about the causal model, the ontological structure, of the domain of software exploitation; it gives no consideration whatsoever to how to assign possibility or probability to a particular configuration of known facts. Excused from needing to present some human-tractable list of choices (as in CVSS or SSVC), Vulntology is able to map out the space in much finer detail. And it does.
I have something of a fondness for such efforts, having written an entire manifesto on the necessity of one for software generally. Vulntology strikes me as an important contribution to the problem. To the nominal schemes like CVSS and SSVC it provides a feedstock of future variables and levels to mine. To EPSS, Vulntology-annotated data would provide deeply enriched data that close the gap between possiblistic and probablistic views of vulnerabilities.
Vulntology may also serve a purpose which CVSS, SSVC and EPSS are ill-suited to serve: guidance for software developers. SSVC and EPSS are both incompatible with this role, and CVSS is ... clunky. In a past life I wrote a study on using CVSS to guide software development efforts for security-centric software systems. My conclusion was largely unhappy, insofar as the Base Score didn't provide a lot of guidance in itself as to how work should be prioritised. I haven't tried it, but I can't help but wonder whether Vulntology wouldn't prove more useful in the role. At the very least, it could provide useful prompts for threat modeling exercises.
But for operational security folks, Vulntology is not immediately applicable in itself. It is a statement of the "is" and "has". But that doesn't tell you how to prioritise this set of values over that set of values. It's a schema, not data. Still, I found it interesting and distinct enough to include in my discussion.
The future of CVSS
In their defence, the authors and designers of CVSSv3.1 are not fools. They are highly qualified and experienced; far more than I am. And they can read the same critiques I can and draw their conclusions therefrom. Reading through the lines, theirs is a stressful position. CVSS determines the priority of most of the information security universe, but all the authors ever hear is criticism (uhm, hello) rather than praise. Not an easy gig.
Their ongoing attention to their own experiences and the experiences of others means that there is likely to be such a thing as CVSSv4 some day. In late 2019, some of the proposed changes for v4 were collected into a single document; discussions appear to span several years. It's not clear what has happened since. Again, I can't find a mailing list, a forum or meeting minutes. The development of CVSSv4 is largely opaque to outsiders, apart from this document. Frustratingly, repeated reference is made to the existence of such things. I just can't find them.
What can be gleaned is that CVSSv4 will not be a radical departure from its ancestors. It will maintain the same core architecture: a selection of nominal variables will be converted into a numerical score by equation. There is a brief reference to Towards Improving CVSS, but it languishes without an assigned owner at the very bottom of the document.
Most of the proposed changes in the document relate to adding new variables or changing existing variables, including tweaking their numerical values. In some ways this resembles a response to the spirit of the Risk Based Security critique (and to a lesser extent the SEI critique); that certain variables were incomplete or ill-defined. For example, consider the SEI complaint that Impact doesn't have any way of considering human lives. The authors weigh introducing a newer variable:
Collateral Damage (CDP) might be good to reintroduce, and could be tweaked/renamed to be a "Safety" (S) metric. I think this will be important as we see more car and medical device vulns in the wild. The vuln itself doesn't directly hurt people (only abuses the software/system), but may result in human injury. It strikes me as something important to include to boost the score to Critical territory whenever human injury/life is involved, even if the vuln is on its own pretty weak.
The same topic shows up in several forms:
Measure whether a successful exploit can cause physical damage and/or harm to living beings. Max Heitman uses the term "kinetic impact". People working with medical device vulnerabilities would like to see the addition of a measurement like this.
Nothing as radical as a wholesale conversion of the architecture into a decision tree or purely data-driven probability model is seriously countenanced. There are however limited signs that probability has entered into thinking about CVSSv4. For example:
The choice of which metrics to include in v4.0, and the “quantification” of their effect on the final exploit likelihood calculation should emerge from a joint research effort using real data on exploits in the wild, as opposed to being purely “expertise driven”. Ideally, that data could come from the SIG itself, anonymized and/or aggregated as needed.
And:
Still, with hundreds of vulns out there, some of the most effective measurement is “Is there a metasploit module?” and if so, you can patch. So… that makes a fairly strong argument for tracking some kind of exploitability.
These sounds very much like EPSS, and I can't help but wonder if these discussions are part of the EPSS origin story. Sure enough, EPSS shows up in a discussion of "how CVSS can better reflect the risk of a vulnerability being exploited".
Of interest, Impact metrics may be separated into their own group:
A proposal to add a vendor-supplied Severity Metric Group, including attributes such as Category of Exploit, Kinetic Impact, Collateral Damage, Motility (wormability), and Persistence, was proposed on 2020-04-15 and discussed in detail during the 2020-04-16 CVSS SIG meeting.
You may recall my complaint, and the SEI's that adding Impact and Exploitability scores was arguably quite nonsensical. I don't see separating Impact metrics into another group will address that, unless the mathematical relationship becomes one of multiplication of the Impact and Exploitability dimensions into a third dimension representing risk or severity.
A lot of these proposed changes make some sort of sense, within the existing framework of CVSS's design. Adding variables and levels to capture more of the causal model helps to deal with paradoxes and corner cases that I didn't go into in any depth (eg. an exploit in Chrome on the desktop and on a server that renders webpages can't have the same score). But my fundamental concern remains that the mapping between ordinal levels and a numerical score isn't a proper, well-defined operation. I feel like a kid disagreeing about the rules of a game: you can't do that! But I don't think I or anyone else will influence CVSS away from its current architecture.
Conclusion
CVSSv3.1 is a flawed scheme, arguably fatally so, and I wish we could have something better. By no means am I saying that I could do better — studying these systems has convinced me of how hard it is to design one. I just believe, without much evidence beyond existing alternatives, that a better system exists and will be discovered or developed some day.
But I'm a realist. Most folks don't pay attention to how the sausage was made, they just eat the sausage. The beefy flavour and firm bite of the CVSS sausage is widely known. It's familiar. Folks feel that they understand it. 9.8 means "Critical". OK, I can grasp that. Let's patch it.
Indulging in some punditry, I think about the best we can hope for is that (a) CVSSv4 will elaborate one to three new variables which increase causal model coverage and (b) that EPSS becomes a commonly-used second signal to balance out CVSS. I doubt that SSVC will ever see much traction (if it does I would hope it too develops a more complete model of the vulnerability domain). But we're stuck with CVSS.
Since we'll be eating it forever, let's at least be health-conscious sausage consumers and read how the sausage was made. Hopefully this article has been a helpful start.
Postscript
In the weeks following publication of this piece, I was contacted by folks working on CVSS, EPSS and SSVC (there is considerable overlap between these groups). A bit of a surprise, I'd somewhat expected to fly safely under the radar. I also saw another critical article about CVSS which I'll briefly discuss.
As I had expected, folks working on CVSSv4 are conscientious and determined to be thorough (likewise for EPSS and SSVC). Dave Dugal and Dale Rich of the CVSS SIG were eager for feedback and very friendly, considering how sharply this essay dealt with v3.1.
CVSSv4
From what I was allowed to see, this is a hefty revision. I have been asked to keep the details closed for now as the group is continuing to work on it. Painting in broad terms, the system looks on the one hand to embrace a simpler formula and on the other to add new input factors and levels. Compared to the 2019 document I discuss above, there is a fair amount of progress and change.
I am still witholding a change of heart. Work so far has progressed to identifying and fleshing out input factors and levels, but not yet to the construction of the equation(s) that map from the ordinal inputs to the output score. I gave my feedback that if impact and exploitability subscores reappear in the new design, that they should be combined by multiplication rather than addition, since they represent different dimensions. But I am still concerned that the very act of numerical operations on ordinal variables is in some sense an arithmetical sin.
My second piece of feedback was to avoid trying to fit a Normal-like or Poisson-like distribution. This too awaits the development of the exact equations which will go into the final v4 scoring.
Having had time to reflect on CVSS further, I find myself wondering now if fitting all these complex permutations of factors and levels into a single 101-bucket range would be better served by being fully and explicitly ordinal. That is, instead of 0.0 to 10.0, each permutation would be identified by a number in descending order of severity. The 1st level would be with all factors set to their most dangerous levels, the 2nd would lower one, and so on.
There are two problems with this undeveloped thought bubble. The first is that it would require an enormously tedious process of manually sorting every permutation, especially since CVSSv4 will have more such permutations to assess and because many cases would be arguably indistinguishable. The theoretical worst case is pairwise comparison between all pairs, which is exponential in the number of permutations. Approximately 30 people participate in the CVSS SIG. It's a bit rich to ask them to perform millions of comparisons. The second problem with the thought bubble is that the 0.0-10.0 scoring framework is, in some sense, a defining feature of CVSS. Change that interface and it's no longer the same thing. If nothing else, everyone whose database schema or API schema expects that 0.0-10.0 range would require more effort to adapt than otherwise.
As I alluded to above, I came across another scathing critique of CVSSv3.1. It is CVSS: Ubiquitous and Broken by Henry Howland. The criticisms are wide-ranging. Some of them I have already canvassed, some I have not. For example, Howland attacks as inconsistent that on the one hand, CVSS is positioned as a vulnerability measurement, but on the other hand, the extended factors (which I ignored for tractability in my writing) include "Exploit Code Maturity", which is a measure of threat. Continuing on the extended factors, Howland complains that the "Environmental Metrics" (which allow the Confidentiality, Integrity and Availability factor levels to be adjusted by an end user for their environment) can't be economically applied in a large organisation, because such an organisation may have a very large and heterogeneous usage of any given software.
But perhaps to be honest, the criticism you pay the price to look at is in §5, "CVSS Severity Measurement Efficiacy" and in §6, "The Wrong Factors - Scoring Issues".
In §5, Howland studies whether CVSS scores are able to predict the incidence of exploit code being developed and applied to attack real systems:
Vulnerabilities that are more severe should in principle mean that they are more attractive candidates to develop exploitation and weaponization mechanisms for. As severity has a direct relationship to the value that exploitation of a vulnerability provides an attacker, a more severe vulnerability would in principle allow a greater impact on a given environment [21]. This in mind, if CVSS is an accurate gauge of a vulnerability’s severity, there should be a linear correlation between the CVSS v3 score of a CVE and the likelihood of that CVE having been presently or historically weaponized.
Howland's finding, summarised in Table 6 of his article, is that:
As the data in Fig 2 and Table 6 indicate, there is no linear relationship between a CVE’s CVSS v3 score and its weaponization status. In fact, it may be the case that CVEs with loored CVSS v3 scores of 7 are actually the most severe on average, measuring severity by their likelihood of actual exploitation. We can also see an issue of poor overall spread of the CVSS scores, which is shared by the weaponization of the CVEs. If a resource-constrained IT organization set out to minimize risk by increasing their resistance to attacks, they would be better of patching any random 100 CVEs with a CVSS score of 7 than they would by doing the same for a group of CVSS 10s.
Put another way, Howland's hypothesis is that if a CVSS score is higher, then it should see more exploit code developed as a fraction of all vulnerabilities reported. In such a case we'd expect to see the fraction of vulnerabilities being exploited peaking in the 9.1-10.0 range, but that is not what's observed. Instead, when values are rounded to the nearest whole number, scores of 7 show the highest fraction of exploit development. Similarly, more exploits are developed for scores at 5 than for 6. Attackers do not appear to use CVSSv3.1 to prioritise their efforts. Why should defenders?
In §6 Howland more or less attempts to reverse engineer the CVSS equation as an opaque box. This is done by studying correlations between the input factor levels and the observed attacks in the wild (based on a dataset by Qualys). The resulting correlations, in Table 7 of the article, are weak. The strongest is Privileges Required at ρ = 0.180. Howland concludes that:
... there is no one vector in CVSS that can be correlated to the weaponization of a vulnerability.
In fairness, CVSS does not set out to measure or predict rates of attack; it is instead a mapping from input factor levels to an ordinal ranking, based on aggregated expert judgement. If you want a scheme based on probabilities of exploitation, what you want is EPSS. But that raises the inevitable question: why prioritise according to CVSS, if it doesn't lead to the greatest reduction in risk?
I'm not sure what feedback I would take from Howland's article, though. Like my own writing above it provides criticisms based on observed data, which means at least that these statistical operations can be used as a benchmark to examine the performance of any new equation(s). But the bridge between the fundamental architecture of CVSS and these observations might be too far to cross. I'm not sure; it strikes me as one of those problems that would require sustained thought and discussion to unpick.
Before moving on from CVSS, I want to emphasise again that I admire the thought and effort the development of such a scheme requires. I have my complaints but I don't doubt the genuine intent and determination of the CVSS SIG.
SSVC
Folks working on SSVC interpreted two sections of my writing to mean that SSVC's documentation is unclear. The first and simplest was my observation that SSVC, like EPSS, changes over time as exploits become available. The question is how to better document why the tradeoff is made this way. It's a valid tradeoff, but worth at least an aside.
More complex to explain is the "value of simplicity". In my article I noted that CVSS as it stood had a wider coverage of factors which could arguably be said to influence the severity of a vulnerability. In CVSSv4 this promises to be even more the case, as it looks to add new factors to the calculation. As noted in the Github issue I link above:
I think it is possible that within the context of this paragraph, different stakeholders have different "causal models." If that is the case, SSVC and CVSS are not directly comparable. I'd like to explore if this is a reasonable basis to understand the "causal model" idea, because I did not so much think of SSVC as having a causal model. And at least, insofar as it does, the "stakeholder specific" thing means I think it might have multiple.
This is a subtle observation and one I did not make. To be honest, I'd thought that "Stakeholder-Specific" was there to set up a clever palindromic abbreviation of CVSS: SSVC. Apparently this is not the case, since different stakeholders may reasonably disagree about what factors are influential and therefore deserve to be part of the SSVC decision tree. I don't have concrete feedback to give here, but I'm glad I could contribute tangentially.
EPSS
Last but by no means least, I was able to meet some folks who work on EPSS. This work is ongoing; the EPSS SIG are aware that EPSS needs in some sense to be turned into a regularly-updating production system, versus the effective but ad hoc scheduling currently in place. As I noted above, there is overlap between people working on CVSSv4 and EPSS, to the degree that some of the mathematics may be developed by the same person or group of persons. Some might see this as unfortunate, but I see it as healthy cross-pollination within the highly specialised ecosystem of people who work on scoring systems.
1 The code is MIT licensed:
/* Copyright (c) 2019, FIRST.ORG, INC.
 * All rights reserved.
 *
 * Redistribution and use in source and binary forms, with or without modification, are permitted provided that the
 * following conditions are met:
 * 1. Redistributions of source code must retain the above copyright notice, this list of conditions and the following
 *    disclaimer.
 * 2. Redistributions in binary form must reproduce the above copyright notice, this list of conditions and the
 *    following disclaimer in the documentation and/or other materials provided with the distribution.
 * 3. Neither the name of the copyright holder nor the names of its contributors may be used to endorse or promote
 *    products derived from this software without specific prior written permission.
 *
 * THIS SOFTWARE IS PROVIDED BY THE COPYRIGHT HOLDERS AND CONTRIBUTORS "AS IS" AND ANY EXPRESS OR IMPLIED WARRANTIES,
 * INCLUDING, BUT NOT LIMITED TO, THE IMPLIED WARRANTIES OF MERCHANTABILITY AND FITNESS FOR A PARTICULAR PURPOSE ARE
 * DISCLAIMED. IN NO EVENT SHALL THE COPYRIGHT HOLDER OR CONTRIBUTORS BE LIABLE FOR ANY DIRECT, INDIRECT, INCIDENTAL,
 * SPECIAL, EXEMPLARY, OR CONSEQUENTIAL DAMAGES (INCLUDING, BUT NOT LIMITED TO, PROCUREMENT OF SUBSTITUTE GOODS OR
 * SERVICES; LOSS OF USE, DATA, OR PROFITS; OR BUSINESS INTERRUPTION) HOWEVER CAUSED AND ON ANY THEORY OF LIABILITY,
 * WHETHER IN CONTRACT, STRICT LIABILITY, OR TORT (INCLUDING NEGLIGENCE OR OTHERWISE) ARISING IN ANY WAY OUT OF THE USE
 * OF THIS SOFTWARE, EVEN IF ADVISED OF THE POSSIBILITY OF SUCH DAMAGE.
 */
There is also an independent implementation by NIST.